The goal of this lab is to implement code in Jupyter Notebook to detect human gestures and
monitor breathing via sound signals. We have provided you with all of the code to show
the processed outcome (eg spectrograms, plots etc.), but you will need to implement some
parts of the FMCW code to enable the sensing.
The human gestures part of this lab is based on an MIT 6.808 project in Spring 2021 by Cooper Jones,
Willie Zhu and Jan Wojcik.
Known problem: Do not use Google Colab to run the .ipynb. The PortAudio library cannot
be used in Colab.
Installation
Start by downloading the Anaconda software. After installing, open
the Anaconda Navigator and click on launch for Jupyter Notebook. It should open in Chrome.
In the browser, change directory to the folder where the provided notebook locates, and then click
on the notebook. It should open a new tab. You can see the notebook and the code.
For those unfamiliar with .ipynb, the order in which you run the cells matter, so be aware when going back
through different parts of this notebook (as in section 2)
Read this link before you begin lab2.
Also, review lec4
slides
if needed. Make sure you understand the following questions
What is FMCW? How does it work to detect distance?
Why can we use the phase to track small movement?
Section 1 — Recording and processing FMCW Signals
The goal of this section is to successfully obtain spectrograms from the recorded FMCW signals. In the next
section you will extract gestures using these spectrograms.
The basic sequence is as follows:
Simultaneously transmit and receive FMCW (i.e, chirp) signals from your laptop
Multiply the received FMCW chirp with the transmitted FMCW chirp, for each chirp you should see a peak
in the baseband
Pass the output of the multiplication through a low pass filter
Extract the peak and convert it to distance using the slope of the FMCW chirp and the speed of sound
Record distance estimates from different chirps and plot them as a function of time
Observe how the plot changes with different gestures.
Section 1.1: Transmit and receive a single tone
Before you can start transmitting and receiving FMCW chirp signals, you need to know how to transmit a single
frequency, what it sounds like, what it looks like in the time and frequency domains, and what its
spectrogram looks like.
To do this you will need to implement the “play_and_record” function. Given a frequency, sampling rate, and
duration as input, this function should play the corresponding sound (using the speaker) and record it
(using the microphone); it should also return the recorded sound.
You should write code to do the following:
Create the time domain signal x of frequency. It is a single tone (or frequency), i.e., a single sine or
cosine wave.
Play that sound and record it. You can use "y = sd.playrec(x)" to play the signal x, which will be
recorded by the microphone and stored in array y.
Once you have successfully implemented this function, execute the code that comes after the function
definition. You should hear a loud 10kHz tone for 2 seconds. When you run the following code blocks, you
should be able to see what the signal looks like in time and frequency and what the spectrogram of the
signal looks like.
Known issue for Mac Laptops: When running the “sd.playrec()” command, Google Chrome might
ask for permission to get access to the microphone, please give access when you get this message otherwise,
this command will only play the sound but it will not record it. If you didn't give access then you will
need to go to microphone settings in Mac and there you can give microphone access to Chrome.
Once everything is working fine, you should run subsequent blocks to see the received signal in the time
domain, frequency domain, and the spectrogram.
Section 1.2: Transmit and receive a FMCW chirp
In this task, you will transmit and record a FMCW chirp signal. To do this you will need to implement the
"play_and_record_chirp" function. Specifically you need to do the following:
Create a chirp signal using the "chirp(t,f0=x,f1=x,t1=x,method='linear').astype(np.float32)" command
where t is the time vector for your chirp, f0 and f1 are the starting and ending frequencies of your
chirp, t1 is the chirp duration, and "method" tells you how the frequency should change as a function of
time.
Create a variable which has multiple repetitions of this chirp so that the total duration of the signal
matches “total_duration”.
Play that sound and record it. You can use "rx = sd.playrec(tx)" to play the signal tx, which will be
recorded by the microphone and stored in array rx
Note: If the microphone is not able to record a good signal, try increasing the amplitude of
your transmitted signal (tx) by scaling the entire signal by a constant factor i.e. 500 or 100
After you have successfully implemented this function, run the subsequent block. You should hear a periodic
sweep from your speakers.
Subsequent code blocks do the following:
Segment the transmitted and received FMCW signal into small chunks so that each chunk contains one FMCW
chirp signal, this segmented data is stored as an array in “rx_data “and “tx_data”
Plots the FFT (frequency domain representation) of the first segment , i.e “rx_data_sample”
Mixes the first segment with the transmitted FMCW segment and plots the FFT of the mixed signal i.e.
“multiplied_fft” (you should see a peak here below 5000 Hz)
Filters the mixed signal using a low pass filter, plots the FFT again and obtains the peak location
(stored in “peak_location”)
Repeats the same steps for all segments (“all_multiplied” and “all_multiplied_ffts”) and shows how the
spectrogram looks like for different consecutive segments.
Section 2 — Extracting gestures from FMCW signals
Notice that the spectrograms look relatively similar. In this section, we will see how performing background
subtraction allows us to track movements in the environment.
Section 2.1: Implement background_subtract
In this task you will perform background subtraction from the received FMCW chirp signals. To do this you
need to implement the background_subtract function that takes in a series of mixed chirp segment FFTs (i.e.
all_multiplied_ffts) as input. Specifically you need to do the following:
For all the chirps c1, c2, ...c_n, average them up and get the mean signal.
This mean signal represents the background.
Subtract each chirp with the background signal.
Subsequent code blocks do the following:
Get the peak locations for all of the segments and obtain the median peak location
Use the median peak location to zoom in on the subtracted FFTs (output of “background_subtract()”) and
store it in subtracted_filtered
Plots the spectrogram of the zoomed in subtracted FFT
Get the peak location in the subtracted FFT segments and plot them (stored in “argmaxes”)
Section 2.2: Implement idx_to_distance
In this task you will estimate the distance using the peak location. To do this you need to implement the
“idx_to_distance” function which takes the peak location as input. Specifically you need to do the
following:
Implement the following equation:
𝑑𝑖𝑠𝑡𝑎𝑛𝑐𝑒=(Δ𝑓 / 𝑠𝑙𝑜𝑝𝑒.𝑣)/2
where "v" is the speed of sound in air, "slope" is the slope of your FM W chirp (Hz/s) and " Δ𝑓 "
corresponds to the peak location.
Store the result in the “distance” variable and return it as an output of the function.
Hint: The index of the peak is not equal to Δ𝑓 because it is not in Hz, how can you
convert it to Hz?
Once you have successfully implemented this function, and if you run the next code block. It should plot the
distance variation as a function of time.
Section 2.3: Extract Gestures
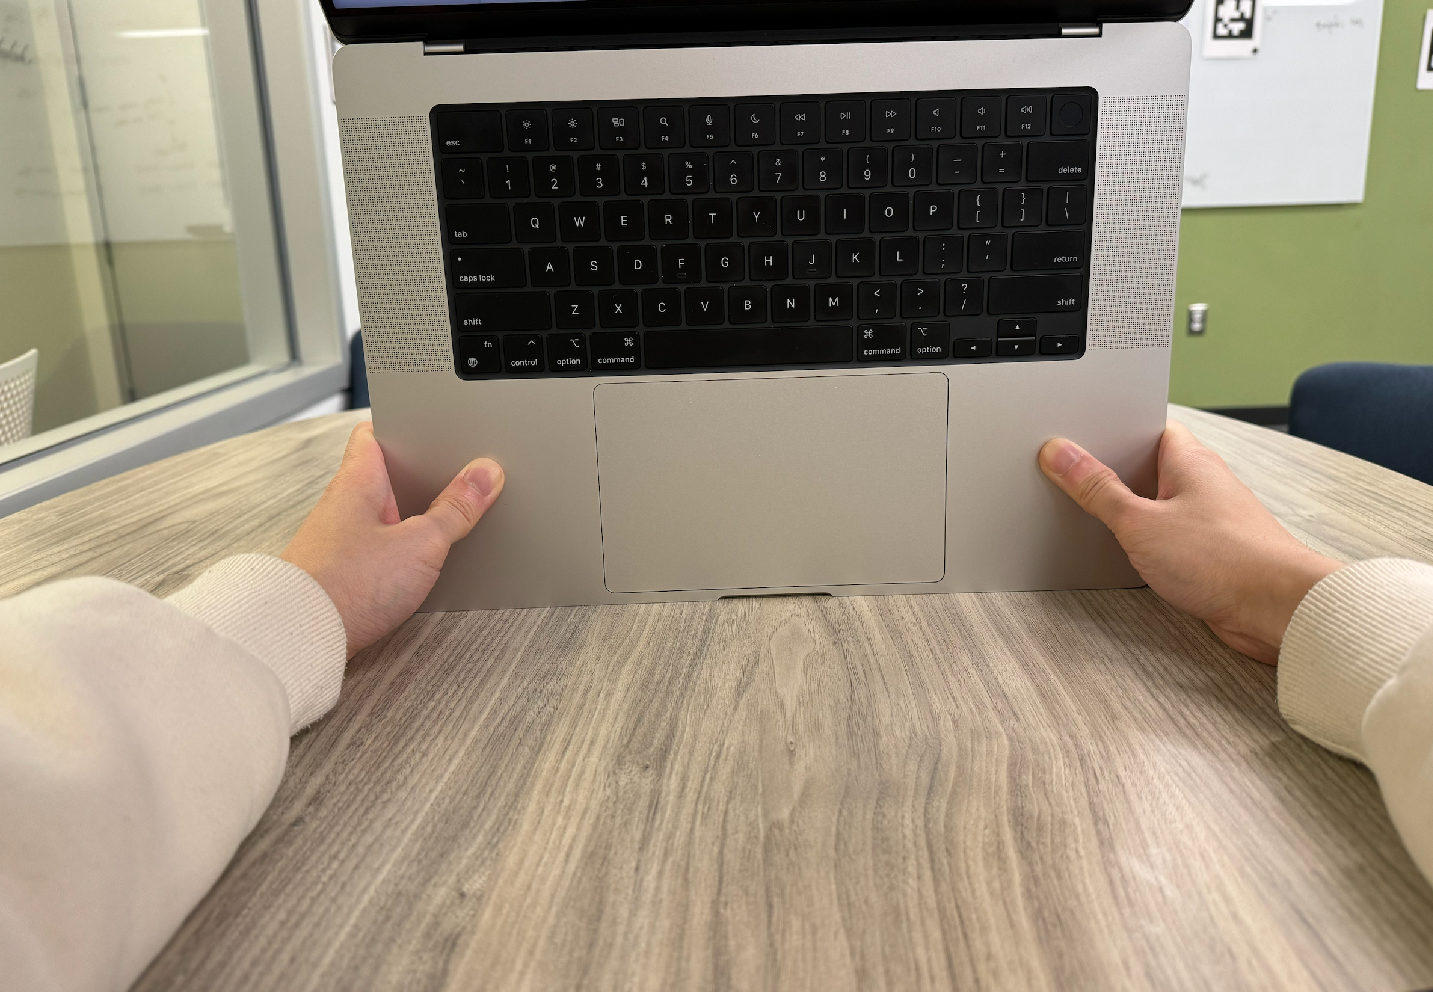
In this task, you will record different hand gestures. Put you hand about 25 cm above the speaker of the Mac.
While the chirp sound is playing, do the following two gestures separately:
Move your hand up, bring it down, and then move it back up
Slowly move your hand up and down 4-5 times
For each case your hand movement should be aligned with the direction of the sound.
Tasks:
Take a screenshot of the plot titled “After background subtraction”,
do this for both gestures separately (2 plots)
Take a screenshot of the distance vs time plot, do
this for both gestures separately (2 plots)
Section 3 — Monitor breathing from FMCW signals
In this section, we will use the phase to track small movement. For example, we can use
the phase of FMCW signal to monitor the breathing.
Section 3.1: Extract the Phase
We first implement the missing code in the block under Task 3.1.
You will need to do background subtraction for the mixed signal, compute the amplitude (absolute
values) of the FFT result, and compute the phase of the FFT result (use np.angle()).
After that, we are ready to monitor the breathing. Before playing the sound, use your hands
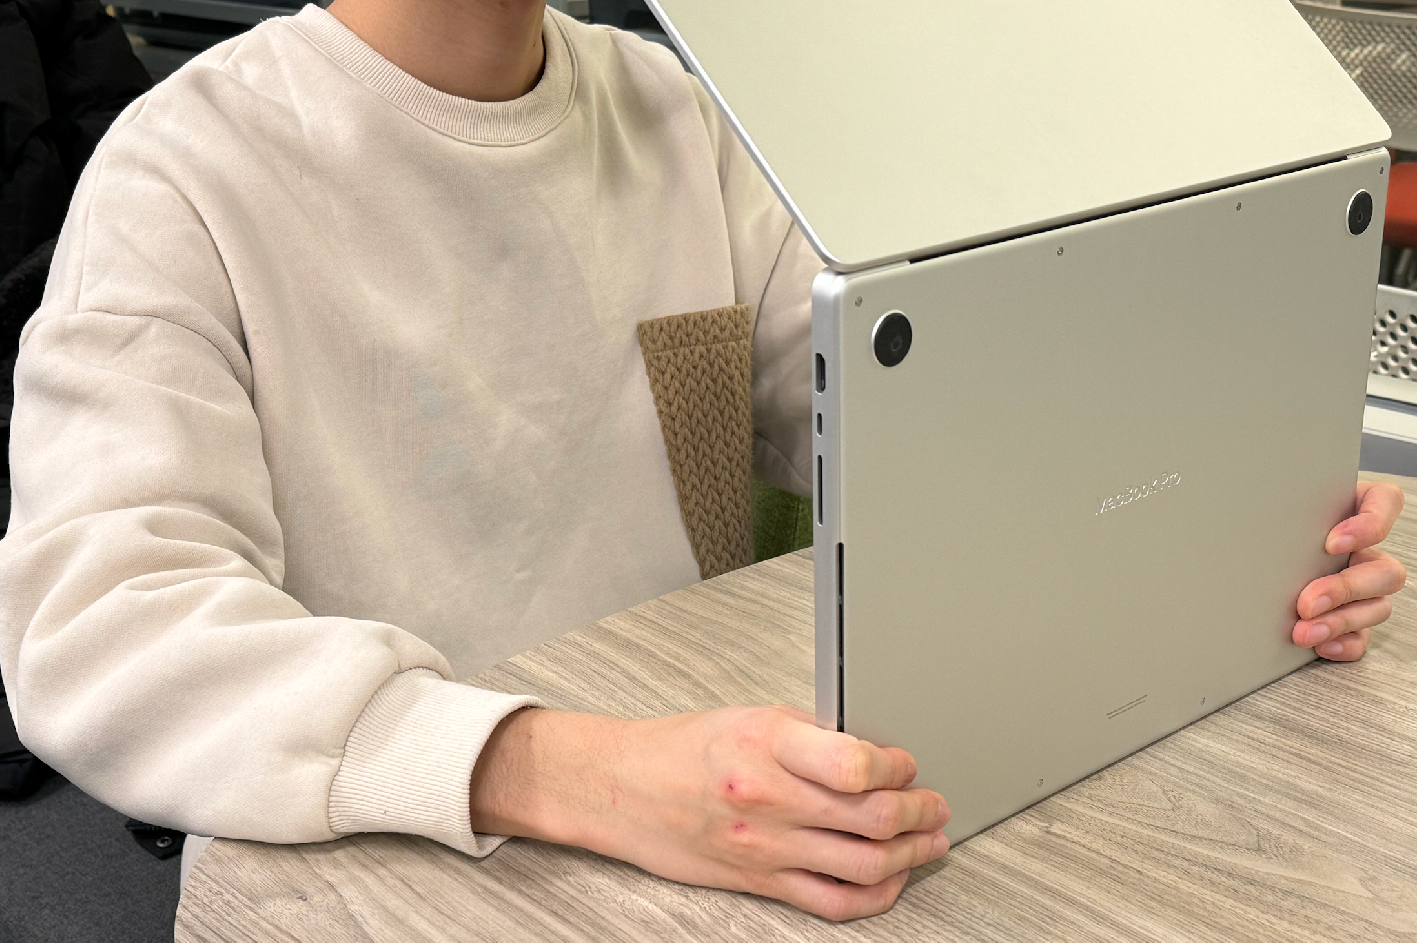
to hold the mac so that its speaker is directly facing your chest. Keep the mac about
40 cm away from your chest and hold it still.
Tasks: Do the following breathing patterns separately and save the screenshots:
Inhale and exhale for two times. Then hold your breath to the end
Inhale, hold your breath, exhale, and hold your breath to the end
Note: Keeping the mac 40 cm away from the chest should result in range_bin=15.
If you do not see the expected breathing plot, you can change the "range_bin"
variable to nearby integers (e.g., plus minus 5) to search for the plot.
We also provide pre-recorded data for this task. If you still didn't see the expected breathing plot
after trying several times, you can download them (breathing_1_rangebin=18.npz
and breathing_2_rangebin=21.npz) and use the following code
to load them:
Rembember to change the variable range_bin to the one indicated in the file name (i.e., 18 for this file).
Submission Instructions
Write your answers to the following items in a single PDF file and name it
lab2_${pennkey}.pdf. Zip this pdf and the .ipynb notebook and submite
it in the gradescope.
Names and Penn emails
In the plot entitled “Frequency Domain - Recieved FMCW signal”, why does the output look the way it
does?
In the plot entitled “Frequency Domain - Downconverted FMCW signal”, why is there a single
lower-frequency peak? What does this peak correspond to?
Attach screenshots of Section 2.3:
The "After background subtraction" spectrogram
The distance vs time plot
Do this for both two gestures (i.e., 4 plots in total)
Attach screenshots of Section 3.1:
The "Breath Monitoring" plot
Do this for both two breathing patterns (i.e., 2 plots in total)